Monthly Report
May 2026 Tulsa Market Report
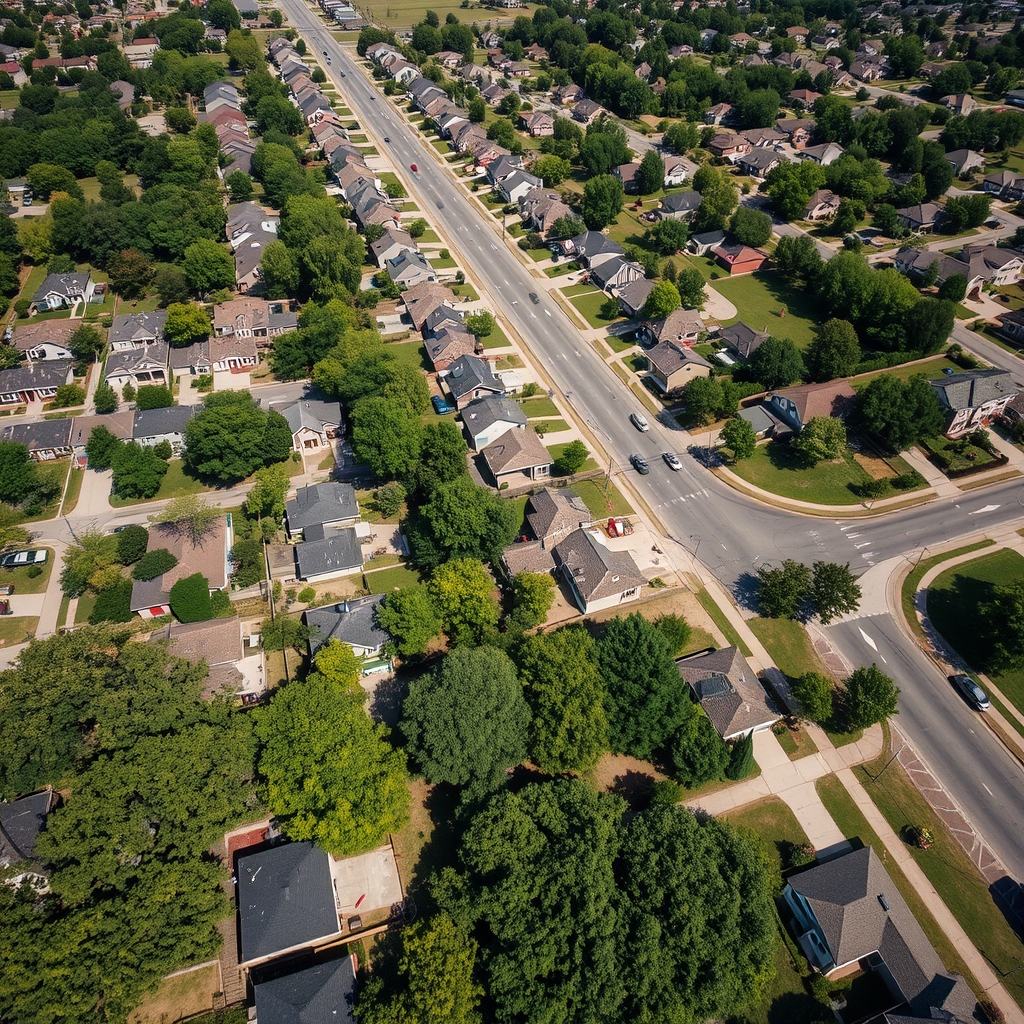
Summer market activity. Median price $277K (+6.5% YoY). 18 days on market. Balanced inventory.
Read Report →Real estate analytics for the Tulsa metro. Data sourced from public MLS records and county assessor databases.

The Tulsa metro housing market remains well-balanced heading into summer. Median home prices reached $277,000, up 6.5% year-over-year from May 2025. Market activity remains steady with 1,057 closed listings and 1,045 pending listings, indicating healthy supply and demand dynamics. Days on market remain favorable at 18 days—well below the national average of 34—reflecting strong buyer interest across price segments. Inventory levels at 2,808 homes represent 3.23 months supply, positioning the market as balanced. Mortgage rates have eased to 6.5%, providing modest relief to borrowers. The $250K to $325K range continues to drive transaction volume.
Summer market activity. Median price $277K (+6.5% YoY). 18 days on market. Balanced inventory.
Read Report →
Pricing, appreciation, inventory levels, and investment returns across both Oklahoma metros.
Read Analysis →
Full-year appreciation data for every Tulsa zip. Top performers and growth drivers identified.
See Rankings →