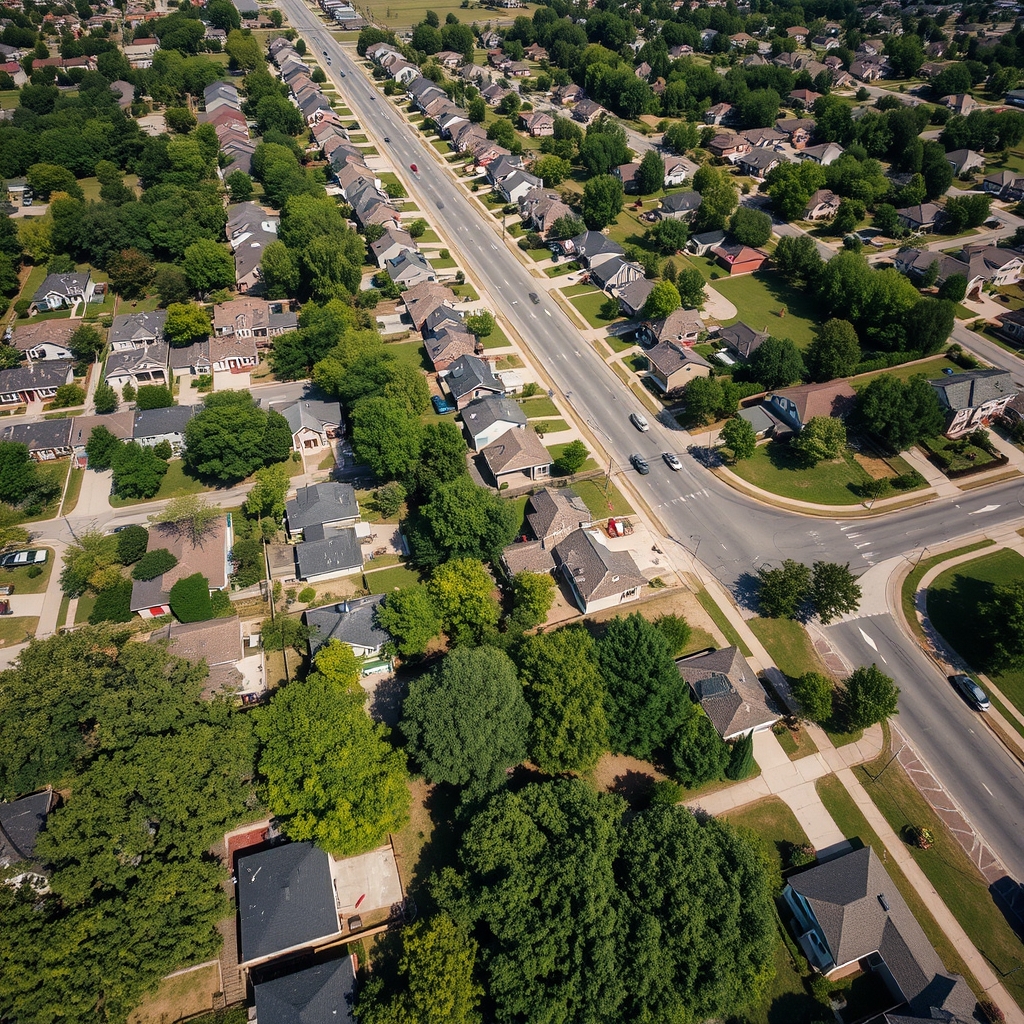
September 2026 Overview
The median sale price in Tulsa County was $289,000 in September 2026, up 3.55% from $279,103 in September 2025 and essentially level with August’s $290,000. The story of the month was supply: active inventory climbed to 2,540 homes, up 2.21% year-over-year and the highest end-of-month count in the five-year series. Homes took a median of 22.5 days to sell, 2.5 days longer than a year earlier, and months of supply held at 3.42.
Key Metrics
Market Analysis
Closings steadied in September after August’s sharp drop. Closed listings totaled 722 on volume of $247.7 million, down 1.37% from 732 a year earlier and slightly below the five-year September average of 742. Month over month the change was small, from 733 in August to 722.
The forward indicators softened. Pending listings fell to 650, down 6.20% year-over-year and 16.99% from August, and below the five-year September average of 684. New listings came in at 1,020, down 2.11% from 1,042 but above the five-year average of 999. The closed-versus-listed ratio finished at 70.8%, up from 70.2% in September 2025.
Active inventory ended the month at 2,540 homes against 2,485 a year ago. Months of supply was 3.42, down 0.70% year-over-year from 3.44 but above the five-year September average of 2.81. Absorption over the trailing twelve months averaged 743 sales per month.
Price Trends
Median list price at closing was $291,250 against a median sale price of $289,000, putting the median sale-to-list ratio at 98.95%, against 99.01% a year earlier and the lowest monthly reading since the residential basis began in June. Year to date the median sale price is $290,000 versus $279,000 through September 2025, a 3.94% gain.
By size, medians ran $136,250 for one- and two-bedroom homes, $254,950 for three bedrooms, $395,000 for four, and $542,500 for five or more. The $250,001 to $325,000 band led volume with 152 closings, 21.05% of the month.
Buyer Outlook
Buyers have more to choose from than at any point in the last five years. With 2,540 homes on the market and a median of 22.5 days to sell, there is more room to compare and negotiate than in the spring. Selection is widest at the upper end: months of supply runs 4.60 between $375,001 and $500,000, 5.23 between $500,001 and $700,000, and 6.11 above $700,000, against 2.48 to 2.73 below $225,000.
Price is still the constraint. At a $289,000 median, buyers are paying 3.55% more than a year ago, and the segments under $275,000 remain the tightest.
Seller Perspective
The 6.20% drop in pending sales is the number sellers should weigh, because it shapes October and November closings. Homes are taking longer to sell, and the median sale-to-list ratio slipped below 99%. In the $125,001 to $175,000 and $575,001-and-up bands, the median closing took 29 days.
With inventory at a five-year high, sellers are competing with more listings than in any recent fall. Pricing to the market from day one matters more than it did earlier in the year.
Methodology Note
Figures are delimited to Tulsa County, Residential Property Type. June 2026 onward uses this basis; reports through May 2026 covered all property types in Tulsa County, so those figures are not directly comparable. Year-over-year comparisons above are like-for-like.
Prior-month restatement. This report shows August 2026 end-of-month inventory as 2,455 and July as 2,441, where the August report published 2,416 and the July report 2,367. RE STATS restates inventory as late transactions post. Month-over-month comparisons above use this report’s own series; the year-over-year figures are unaffected.